Sewerage service and treatment system
The integrated water service (IWS) includes the management of the sewerage and treatment system. The water resource, after uses for the various civil purposes, is collected through the sewer pipes and sent to the purifiers. There pollutants are removed via physical processes (filtering, sedimentation, flocculation) and biological ones (aerobic and/or anaerobic decomposition of the organic substance with bacteria).
Thanks to approximately 865 treatment plants (of which 333 managed by Acea Ato 2, Acea Ato 5 and Gesesa), the total volumes of water treated by the Group 119 in 2018 were approximately 859 million cubic metres, of which 604 million cubic metres by Acea Ato 2, Acea Ato 5 and Gesesa. The water in output from the plants cited, after having undergone the purification treatments described, has chemical and biological properties compatible with the life of the receiver body of water and in accordance with the values of the parameters which must not be exceeded in order to guarantee full compatibility (as per Legislative Decree no. 152/2006).
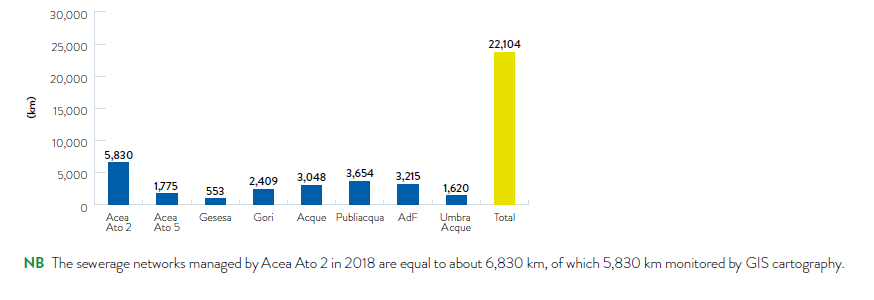
The sewerage networks managed amount to more than 22,100 km, of which 9,158 km relate to the three companies cited.
CHART NO. 46 - THE SEVERAGE NETWORKS MANAGED BY THE GROUP IN ITALY (2018)
[119] Again in this case, the data relating to the number of treatment plants, the volumes treated, the size of the networks and the controls refer to the main Group companies operating in the water sector, including those not included in the full scope of consolidation.
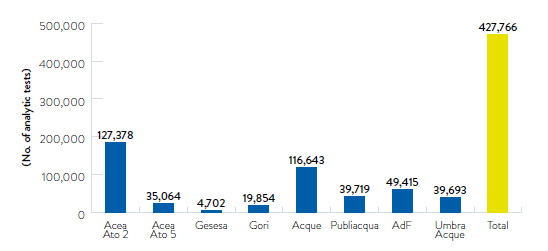
CHART NO. 47 - ANALYTICAL CHECKS ON TOTAL AND COMPANY WASTE WATER (2018)
For the companies operating in the Lazio area and partly in the province of Benevento, the percentage coverage of the sewer and purification services, out of the total users served by the water service, and the volumes of effluent treated are given in Tables nos. 54 and 55.
In particular, for Acea Ato 2, the good abatement performance achieved in the purification process, which allowed approximately 580 million cubic metres of sewage to be made compatible with the receiver ecosystem, were confirmed by the over 127,000 calculations performed. A positive result was in fact confirmed, i.e. values of the concentrations of the contaminants below legal limits, in 94% of the tests performed on water from the plants, moreover in an environmental situation which foresees the observance of some of the strictest regulations in Italy.
TABLE NO. 54 - PERCENTAGE COVERAGE OF THE SEWER AND PURIFICATION SERVICES OVER THE TOTAL UTILITIES OF THE WATER COMPANIES OPERATING IN LAZIO AND AT BENEVENTO (2016-2018)
| company | 2016 | 2017 | 2018 | |||
| sewer | purification | sewer | purification | sewer | purification | |
| Acea Ato 2 | 91.9% | 88.7% | 91.7% | 88.0% | 91.6% | 88.2% |
| Acea Ato 5 | 64.0% | 52.5% | 67.7% | 56.5% | 66.9% | 56.1% |
| Gesesa | 81.1% | 26.2% | 81.2% | 26.1% | 80.2% | 27.3% |
TABLE NO. 55 - VOLUMES OF EFFLUENT TREATED BY WATER COMPANIES OPERATING IN LAZIO AND AT BENEVENTO (2016-2018) (Mm3)
| company | 2016 | 2017 | 2018 |
| Acea Ato 2 | 595.2 | 553.6 | 582.7 |
| Acea Ato 5 | 26.7 | 21.1 | 21.2 |
| Gesesa (*) | - | - | - |
(*) For the time being there are no flow meters at the entry of the purification plants managed by Gesesa. The company intends to install them by the end of 2019.
In the “historic” area managed by Acea Ato 2, which includes Rome and Fiumicino, the main purification plants treated in 2018 approximately 490 million of cubic metres of wastewater, a figure that has increased (467 million cubic metres of effluent treated in 2017). Considering also the smaller purifiers and the plants of the municipalities acquired in Ato 2 (a total of 170) a total volume of approximately 583 million cubic metres of wastewater treated is obtained, an increase of 5% compared to 2017. The cause of this increase was substantially due to the elevated rainfall, since part of the rainwater also flows into the Rome drains system.
Tables 56 and 57 show the details of the main parameters from the Acea Ato 2 and Acea Ato 5 treatment plants. Other indicators of the efficiency of purification are described in the section Key environmental performance indicators - Water Segment of the Environmental Accounts.
TABLE NO. 56 - OUTPUT PARAMETERS OF THE MAIN PURIFIERS MANAGED BY ACEA ATO 2 SPA - MUNICIPALITY OF ROME (2018)
| Rome South purifier | Rome North purifier | Rome East purifier (*) | Ostia purifier | concentration limits in surface waters LEGISLATIVE DECREE No. 152/06 | |
| parameter | average values (mg/l) | ||||
| BOD5 | 15 | 9 | 8 | 4 | ≤ 25 |
| COD | 29 | 20 | 28 | 20 | ≤ 125 |
| SST | 17 | 15 | 19 | 10 | ≤ 35 |
| Nitrogen (ammoniac, nitric and nitrous) | 9 | 11 | 13 | 5 | - |
| phosphorus | 1 | 2 | 2 | 2 | - |
| output quantity (t) | |||||
| COD | 7,957 | 1,676 | 2,285 | 522 | - |
| SST | 4,674 | 1,320 | 1,585 | 245 | - |
(*) The data of the Roma Est purifier are in part influenced by the various maintenance works carried out at the plant during the year.
TABLE NO. 57 - OUTPUT PARAMETERS OF THE MAIN PURIFIERS MANAGED BY ACEA ATO 5 SPA - MUNICIPALITY OF FROSINONE (2018)
| parameter | average values (mg/l) | concentration limits in surface waters (Legislative Decree no. 152/06) |
| BOD5 | 3.7 | ≤ 25 |
| COD | 20.3 | ≤ 125 |
| SST | 6.0 | ≤ 35 |
| NH4 + | 4.3 | - |
| phosphorus | 1.0 | - |
| output quantity (t) | ||
| COD | 1,175 | |
| SST | 493 |
The sludge produced during the purification process is mostly sent for recovery of material (see in Environment Segment, the paragraph High quality compost production). Due to uncertainties about the application of current legislation, 2018 was a difficult year for those who produce sludge and have the burden of managing its disposal or final recovery (see also the dedicated box).
THE SITUATION OF SLUDGE DISPOSAL AND RECOVERY FOR ACEA ATO 2
In 2018, as a result of some legal pronouncements and possible regulatory revisions regarding sludge suitable for agronomic recovery, problems arose along the entire sludge production and management chain.
In particular, there was a critical progressive reduction of the spaces in the treatment sites where the sludge coming from the treatment plants was to be conferred. The situation has been made even more critical due to the extraordinary weather events (snow emergency in winter 2018) that have not allowed the continuous use of the contracted disposal companies.
Following sentence no. 1782 of 20 July 2018 issued by the Lombardy Regional Administrative Court, there was a block on deliveries to disposal plants that guaranteed up to 50% of the company’s disposal space, and Acea Ato 2 made efforts using targeted communications and discussions with the relevant bodies to resolve the critical situation.
During the year, the production of sludge, sands and gratings for all the plants managed amounted to approximately 67,000 tonnes (excluding liquid sludge, which was disposed of to third parties precisely because of the emergency situation), with a reduction of approximately 50,000 tonnes compared to 2017. The company has taken steps to ensure the management of the plants and, in June, the dryer in North Rome.
In addition, measures have been planned for the medium term to reduce the quantities of sludge produced by major plants, including:
- The launching in November 2018 of a technological trial for sludge reduction at the Ostia plant;
- The signing of disposal contracts with foreign suppliers.
These actions will allow for a substantial reduction in the quantities produced in the near future and greater flexibility in the management of deliveries to disposers.