Attention to water consumption
The water consumption of the Group, illustrated in Table no. 63, refers both to industrial processes and uses for district heating and civil uses. The decrease in consumption is due to the reduction in consumption by processes, mainly attributable to efficiency actions at plants of the company Acea Ato 2
TABLE NO. 63 - WATER CONSUMPTION OF THE GROUP’S MAIN COMPANIES (2016-2018)
| 2016 | 2017 | 2018 | |
| type of consumption | (Mm3) | ||
| industrial processes: district heating and others for thermoelectric generation, other Acea Ambiente plants, Water companies of which aqueduct of which well | 0.14 | 0.97 | 0.29 |
| of which aqueduct of which well | 0.080 | 0.896 | 0.211 |
| of which rainfall | 0.000 | 0.003 | 0.000 |
| of which river water | 0.000 | 0.003 | 0.003 |
| from tankers | 0.000 | 0.001 | 0.000 |
| of which recovered water | 0.002 | 0.005 | 0.025 |
| water consumption for civil use | 2.12 | 1.43 | 1.71 |
| of which aqueduct | 2.117 | 1.432 | 1.712 |
| of which well | 0.000 | 0.000 | 0.001 |
| of which tankers | 0.004 | 0.001 | 0.001 |
| total water consumption | 2.26 | 2.40 | 2.01 |
In some plants, projects have been launched to recover process wastewater, to reuse it for industrial use. At the San Vittore del Lazio waste-to-energy plant the rainwater is reused in the process of production of demi water after treatment in a special chemical and physics plant 123. Thanks to the presence of this technology the volumes of water discharged into a body of water were zero and the volumes of water recovered were equal to 12,200 cubic metres.
At the Aprilia composting plant, where the treatment plant for wastewater that can be reused in the industrial cycle has been operating since 2017, approximately 5,900 cubic metres of water have been recycled.
[123] The dedicated chemical-physical plant went into operation in January 2017.
Water leaks
Sustainable water management includes the issue of limiting losses from distribution networks. During 2018, in line with the previous year, the water companies – and in particular Acea Ato 2 – continued its intense search for leaks in order to recover as much water as possible (see box Recovery of losses in Rome and in the municipalities of Ato 2).
Together with the search for hidden leaks, Acea Ato 2 continued dividing the area into districts, aimed at increasing the efficiency of portions of the region, defining interventions or reconfigurations of network structures through the verification of the perimeters of water districts and the optimisation of pressures. To date, approximately 4,200 km of Rome’s distribution network have been studied and 72 measurement districts have been created. For about 1,000 km of distribution network the study was complemented by a mathematical model using pressure control valves and the installation of instrumentation for remote management of the network.
During the year, Acea Ato 2 also carried out network efficiency improvement actions in 21 municipalities in the province. The study focused on 1,200 km of water network (to complement the 1,000 km already examined in 2017), the activity involving surveys,
flow and pressure measurements, map production, user analysis and water balancing, mathematical modelling and searches for leaks. The results of the study and efficiency actions were imported into the GIS systems.
Leak recovery plan in rome and the communities of ato 2
In 2018, following the water emergency that involved the city of Rome in 2017, the search for leaks in the city’s water network continued and was extended to the networks of the municipalities of Ato 2.
The Action Plan provided for the subdivision of the territory to be monitored in lots and the searches for leaks were carried out with the help of operational squads in the various areas, coordinated by a team of experts who then processed the data acquired and directed the repair work.
A total of 10,000 km of distribution network were monitored during the year (for a total of 21,000 km of network monitored since the start of activities in 2017) with the identification of about 2,000 hidden leak.124
[124] Hidden leaks are defined as water leaks due to breakage or malfunctioning of private water systems, whether they are buried or embedded, they are not detectable from the outside in a direct or obvious way.
In 2018 Acea Ato 5 carried out the analysis of the water network (in particular in parts of the territories of Arpino, Pico, Villa Santa Lucia) and the search and repair of leaks, scheduling about 2,654 orders to search for leaks. Moreover,
in the municipalities of Ceccano and Frosinone, reclamation works were carried out on the water networks that allowed a recovery of water estimated at about 4 l/s for the municipality of Ceccano and about 10 l/s for the municipality of Frosinone.
In 2018 Gesesa further developed the division of water networks into districts by extending the reduction of pressures and setting the goal of covering all the municipalities managed.
In 2018, the analysis of the set-up of the water networks and leak detection and recovery led to 291 interventions and the reclamation of about 0.84 km of water supply network.
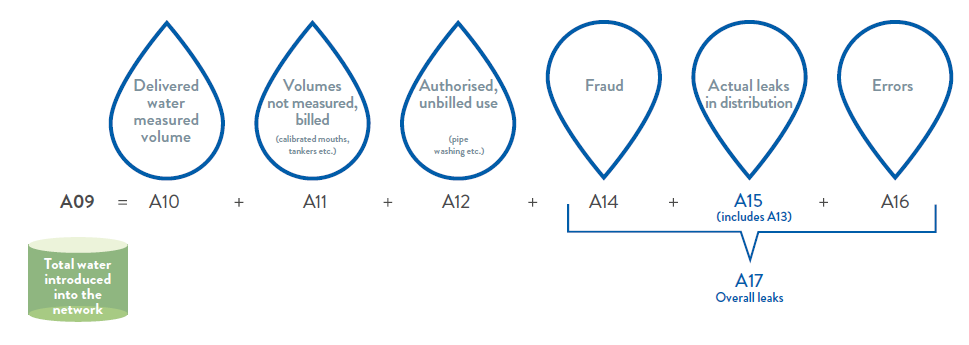
As regards the issue of water losses, in order to make the data from different operators comparable and define the quantities that contribute to estimating them, Ministerial Decree no. 99/97 supplies a reference model, together with the measures with which, in recent years, ARERA has intervened by introducing progressive changes to the calculation process. The water balance data, illustrated in detail in the “Environmental Accounts” 125, were processed, ensuring the comparability of the last three years. Chart no. 48 shows the model specified in Ministerial Decree 99/97, considering the interventions of the ARERA regulation.
[125] The water reports of the companies of Campania, Umbria and Tuscany, with consolidated net worth, can be examined in the chapter Water Company data sheets and overseas activities.
CHART NO.48 – REAL WATER LOSSES (MODEL OF MINISTERIAL DECREE NO. 99/97, REGULATORY INTEGRATIONS OF ARERA)
In 2018, the search and repair of leaks in the city of Rome described above (“historical network”) resulted in a decrease in real losses, which stood at 38% (compared to 41% in 2017). The value of real losses also fell for the entire Ato 2 network to 44% (45.5% in 2017).
In Acea Ato 5 (Frosinone) the real losses in 2018 amounted to approximately 72.8% of the amount injected into the network.
As the figure has increased, an extraordinary plan is expected to be launched in 2019 that will lead to the division of the networks into districts, which – together with the results of a user search campaign that has not yet been initiated – is expected to result in a reduction in the losses.
Finally, at Gesesa the real losses in 2018 amounted to approximately 38%, with a significant improvement (45% in 2017). See the Environmental Accounts for details.