Ownership structure and general economic Indicators
Acea SpA is listed on the Italian Stock Exchange organised and managed by Borsa Italiana. The company is included in the FTSE Italia Mid Cap Index. Roma Capitale is Acea SpA’s majority shareholder, holding 51% of its share capital. At 31.12.2018, other significant direct or indirect equity interests were held by Suez SA for over 23% and Francesco Gaetano Caltagirone at approx. 5% (see Chart no. 5).
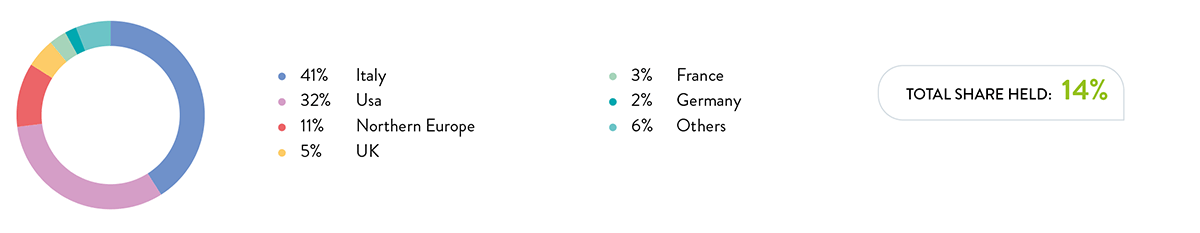
Institutional investors control about 14% of the share capital, with a geographical distribution that shows a predominance of Italian shareholders, followed by those in the USA, Norway and the UK (see Chart no. 6).
Retail investors hold around 6% of the capital.
CHART NO. 5 – PROPRIETARY STRUCTURE AS AT 31.12.2018

CHART NO. 6 – GEOGRAPHICAL REPRESENTATION OF THE INSTITUTIONAL INVESTORS IN ACEA
In 2018, the impetus given to business by the operating areas made it possible to achieve very significant results, both in economic and financial terms and in terms of the quality of service provided to customers, making it possible to see higher results and to anticipate progress in the stages set out in the business plan 17. The main items in the financial statements are all positive: EBITDA increased to € 933 million (+11% compared to 2017) and EBIT amounted to € 479 million (+33% compared to 2017). The Group profit was € 271 million (+50% on 2017).
17 The business plan is expected to be updated in spring 2019..
TABLE 7 - THE MAIN ECONOMIC AND EQUITY DATA OF THE ACEA GROUP (2017-2018)
| (in € million) | 2017 | 2018 |
| net revenues | 2,796.9 | 3,028.5 |
| operating costs | 1,983.8 | 2,138.5 |
| staff costs | 215.2 | 219.6 |
| costs of meterials and overheads | 1,768.6 | 1,918.9 |
| income (expense) from non-financial investments | 26.8 | 43.3 |
| (EBITDA) | 839.9 | 933.2 |
| operating profit (loss) (EBIT) | 359.8 | 478.5 |
| financial operation | (72) | (82.9) |
| investent operations | 0.3 | 13.3 |
| profit (loss) before tax | 288.2 | 409 |
| income tax | 96 | 124.3 |
| net profit | 192.2 | 284.7 |
| profit/loss attibutable to minority interests | 11.5 | 13.7 |
| profit (loss) attributable to the Group | 180.7 | 271 |
Consolidated revenues in 2018 amounted to € 3,028.5 million (€ 2,796.9 million in 2017), up by approximately 8%. All business areas contributed to these revenues, including, in absolute terms, the € 108.2 million increase in sales and services of electricity.
The Water sector recorded an increase of € 55 million, which includes both the best estimate of the premium for the quality of Acea Ato 2’s service and the consolidation of GORI in the Group’s scope from November 2018. Finally, the Environment segment, with its waste disposal and landfill management activities, increased by about € 4 million.
In 2018, external costs amounted to approximately € 1.91 billion (€ 1.76 billion in 2017). The main factors affecting cost dynamics are: higher costs for the supply of electricity (+€ 138.3 million), partly offset by lower transport costs (-€ 56.5 million) and charges deriving from previous energy items and the fine imposed by the antitrust authority for € 16 million. Costs include the increase in water concession fees (+€ 7 million) connected with the mandatory agreement for the hydraulic management of the Peschiera - Le Capore water system, signed in February 2018.
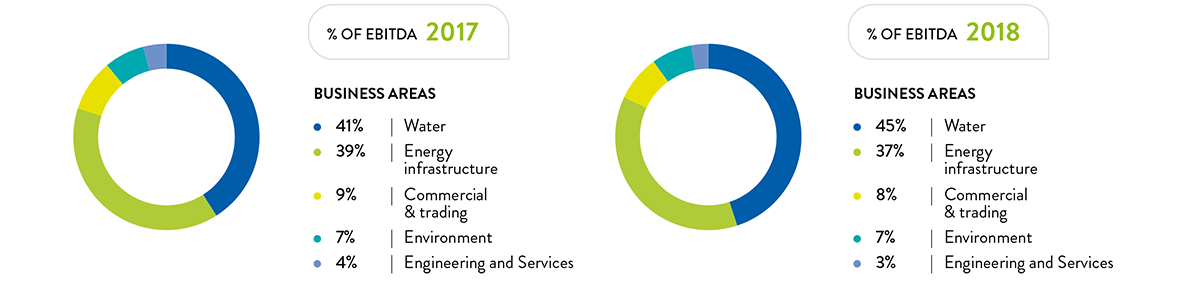
The EBITDA of approximately € 933 million is up by € 93 million (+11%). Net of the consolidation of GORI, non-recurring items and the negative contribution attributed to the antitrust authority fine, the organic growth of the EBITDA is equal to 8%.
The overall value consists of:
- Water operating segment at 45%, with € 433 million, a 24% increase respect to the data from 2017 (€ 350 million). In particular, the performance of the area was influenced by the results of Acea Ato 2 and Acea Ato 5, which recorded increases of € 50 million and € 4 million respectively;
- 37% from the Energy Infrastructure industrial area, with about € 361 million, up about 8% from the previous year (€ 333 million). This positive change is mainly attributable to Areti, following the tariff updates of the fifth regulatory cycle;
- Commercial and Trading operations accounted for 8% of the total, € 76 million more or less in line with the previous year (€ 78 million);
- the Environment industrial area accounted for 7%, with € 66 million, up about 2% compared with the previous year (€ 64 million) due to improvements in performance from the increased supply of waste and greater quantities of electricity sold.
Also contributing to the Group EBITDA are the Overseas segment and the Engineering and Services segment totalling 3%.
CHART NO. 7 – CONTRIBUTION OF THE BUSINESS AREAS TO OVERALL EBITDA (2017-2018)
Operating profit (EBIT) came to € 479 million, up by € 119 million (+33% on 2017). The figure is mainly affected by the growth in EBITDA, the release of provisions for risks set aside for GORI and the lower provisions for bad debts compared to 2017 for the position with GALA.