Quality perceived
For many years, Acea has been monitoring the customers’ and citizens’ satisfaction with the services provided in the electrical, water 32 and public lighting sectors via semi-annual surveys carried out by an institute specialising in public opinion research, identified by tender.
The Stakeholder Relations Unit, within the External Relations and Communications Department of the Parent Company, coordinates the process aimed at periodically measuring the quality perceived by the Group’s customers in agreement with the operating companies that manage the services, and works with Top Management to analyse and understand the data collected.
As in past years, the two half-yearly surveys in 2018 were conducted using the CATI method 33 and the following main indicators were elaborated:
- the overall judgement of the quality of the service (from 1 to 10), is a so-called “gut feeling”, expression of an on-the-spot assessment by customers;
- summary satisfaction indices, both overall and on aspects of the service (Customer Satisfaction Index - CSI, index 0-100) based on the percentage of customers who stated they were satisfied and processed considering the customers’ ratings regarding the individual aspects of the service;
- satisfaction degree indices, both overall and on aspects of the service (Customer Satisfaction Index - CSI, expressed in % of satisfied customers - threshold value 75%) which measure “to which extent” the customers are satisfied or dissatisfied with the service.
As regards the “contact channels”, the interviews involved all of the customers selected using the “call back” method among those who have recently used the services (toll free number for commercial information or reporting faults, website, helpdesk, technical interventions) and gave their authorisation to be called back.
In the following paragraphs dedicated to illustrating customer satisfaction for each service – so-called “perceived quality” – the charts represent the customer satisfaction indices (CSI) calculated during the year. For the percentages of satisfied customers on the most important factors of quality of services and comparison with the results of the 2017 surveys, see Table no. 12.
ELECTRICITY SERVICE RATING
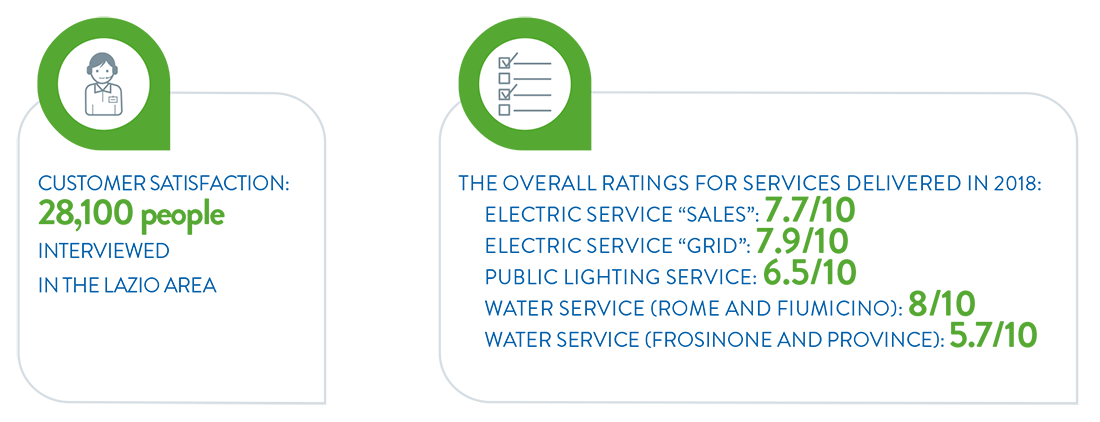
Customer satisfaction as regards the electricity supply service (sale and distribution) was recorded in April/July and November/ December 2018 with comprehensively 13,400 people contacted by telephone, representing customers on the more protected market and on the free market: 8,900 for sales-related aspects, managed by Acea Energia, and 4,500 for technical and management aspects of the distribution service (network), managed by Areti.
The global ratings of the electricity service, reported here as the average of the two semi-annual surveys: 7.7 out of 10 for the commercial aspects (sales) and 7.9 out of 10 for the aspects relating to distribution (network), remaining positive and in line with 2017.
32 - As regards water services, the main results of the customer satisfaction surveys carried out by Acea SpA and reported here concern the customers of the companies Acea Ato 2 (Rome and province) and Acea Ato 5 (Frosinone and province), operating in the Lazio area, and, thanks to an initial survey carried out in the second half of 2018, Gesesa, operating in the territory of Benevento and province.
33 - Computer Assisted Telephone Interviewing of a stratified sample based on variables and representative of the universe of reference, following a structured questionnaire. Depending on the sample, the statistical error varies between +/- 2.3% and a maximum of +/- 4.3% and the level of significance is 95%.
For customers in the more protected market, the overall satisfaction index (CSI) for energy sales activities, already positive in 2017 (88.9 out of 100), improved even more, the average of the two surveys for the year equalling 92.2 out of 100. CSIs for all aspects of the service subject to assessment are stable or rising compared to the previous cycle of surveys. In particular, the CSI for the commercial toll-free number has improved (from 83.6 to 90 out of 100). Similar results also for customers in the free market: the overall satisfaction index rose to 90.9 out of 100 and the individual aspects of the service remained stable or improved, especially the commercial toll-free number (from 84 to 89.7 out of 100).
With regard to energy distribution (grid), the overall satisfaction index is very high (95.5 out of 100) and up compared to 2017 (93.2 out of 100). The CSIs on the service aspects were also excellent, all high and improving, in particular the fault reporting (from 91.8 to 96.7 out of 100). See the dedicated Chart and Table no. 12.
CHART NO. 17 - OVERALL CSI AND ON ELECTRICITY SERVICE ASPECTS - SALE AND DISTRIBUTION OF ENERGY (2018) (INDEX 0-100)
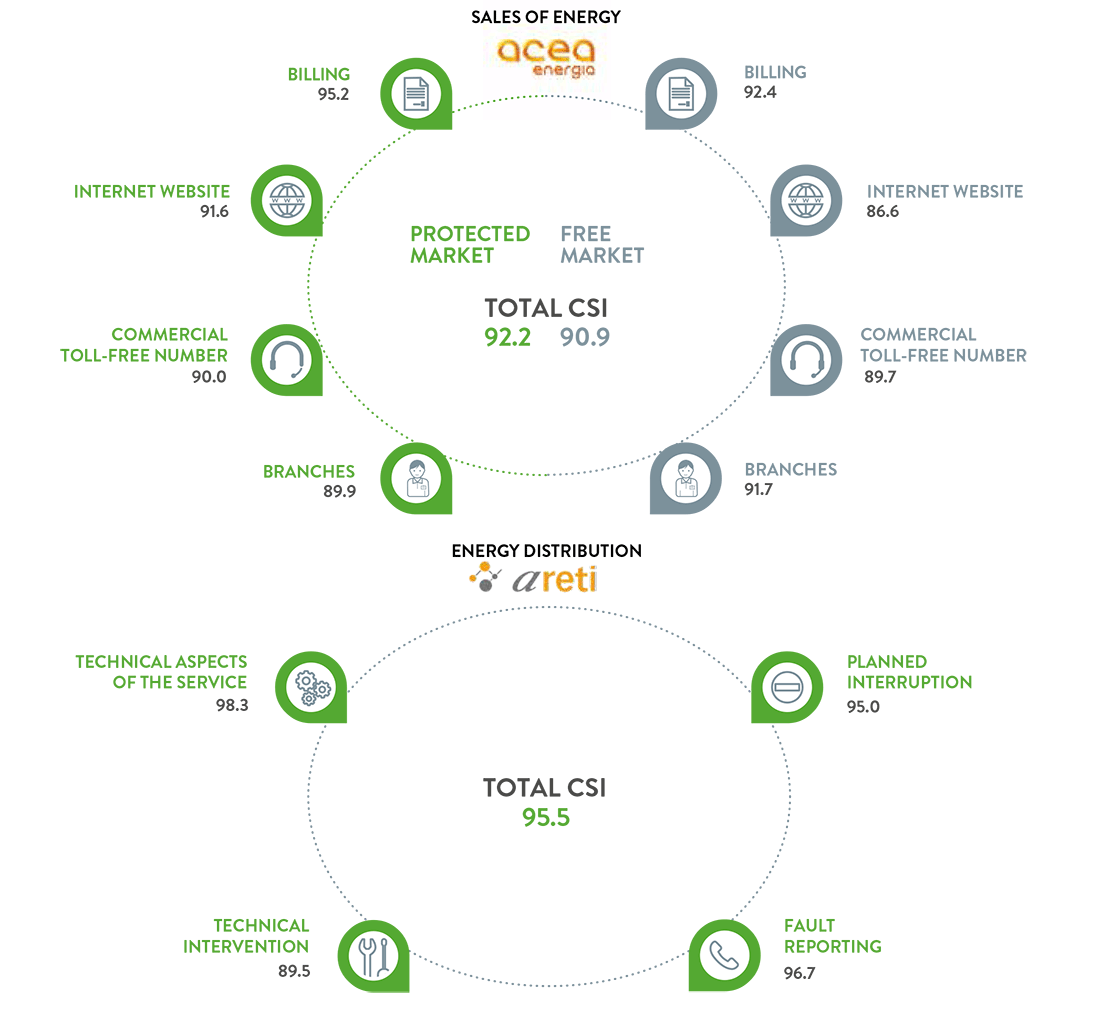
NB The Customer Satisfaction Indexes – overall and on the individual aspects of the service – shown in the chart are the average of the two semi-annual surveys.
PUBLIC LIGHTING SERVICE RATING
The satisfaction level of citizens as regards the public lighting service was surveyed in May/July and October/November 2018, through interviews to 2,900 residents in the municipalities of Rome and Formello. The sample, representing the entire resident population, was identified in 3 territorial macro areas: central-northern Rome and Formello, east-southeast Rome and southwest Rome.
As an average of the two semi-annual surveys, the overall rating of the service remains in line with the previous year and in the area of average satisfaction (6.5 out of 10).
Despite the stability of the overall assessment, the overall satisfaction index for the service, as an average for the two semesters, rose compared to last year to 82.2 out of 100 (compared to 75.7 out of 100 in 2017). The assessments expressed by the public on the technical aspects of the service (75.3 out of 100) and in particular on the fault reporting (92.1 out of 100, compared to 78.6 in 2017) also improved. See the dedicated graph and Table no. 12 for satisfaction percentages on individual items and comparison with previous surveys.
CHART NO. 18 - OVERALL CSI AND ON ASPECTS OF THE PUBLIC LIGHTING SERVICE IN ROME AND FORMELLO (2018) (INDEX 0-100)
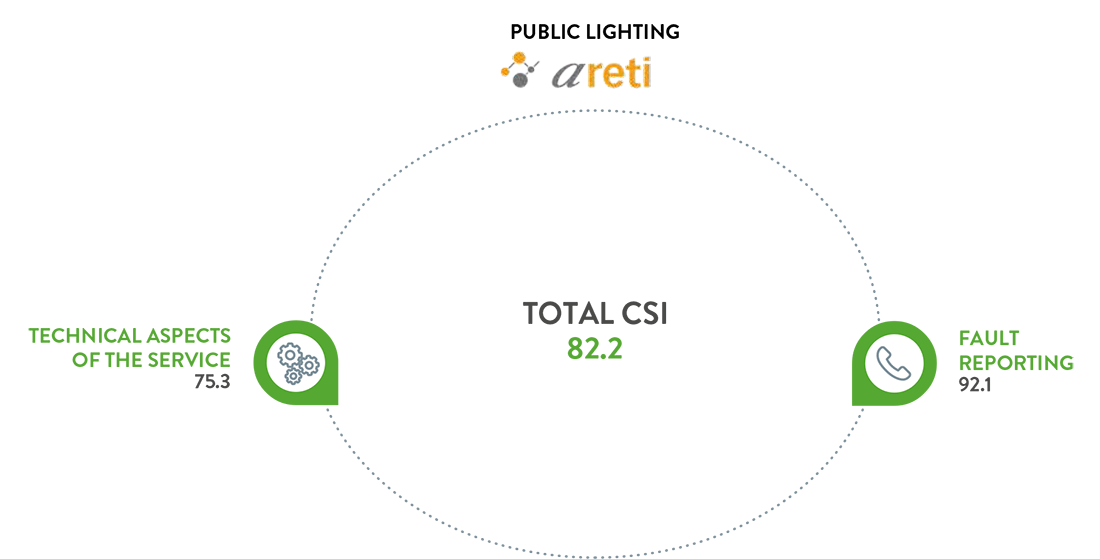
NB The Customer Satisfaction Indexes – overall and on the individual aspects of the service – shown in the chart are the average of the two semi-annual surveys.
WATER SERVICE RATING
As regards the water service managed in Lazio, the customers in Acea Ato 2 (Rome and province) and Acea Ato 5 (Frosinone and province) was satisfied.
In Rome and Fiumicino, the surveys were conducted by telephone interview in March/July and October/December 2018. The sample of respondents, representative of all users, was selected from 4 territorial macro-areas: central-north Rome, northeast Rome, south Rome, southwest Rome and Fiumicino, and has included, in total 5,800 people, including domestic customers, with or without direct utilities, and apartment complex administrators.
The overall assessment of the water service, as an average of the two semi-annual surveys, continues to be positive (8 out of 10) and in line with previous surveys.
The overall service satisfaction index, average for the two semesters, is very high (88.8 out of 100) and has improved compared to last year (84.7 out of 100 in 2017). Satisfaction indices for all aspects of the service being assessed have risen (see the dedicated chart), and more markedly the CSIs on billing (86.6 out of 100, was 80.9 in 2017), technical service (70.8 out of 100, was 64.6) and branch services (88.5 out of 100, was 83.8). See also Table no. 12.
CHART NO. 19 - OVERALL CSI AND ON ASPECTS OF THE WATER SERVICE - SALE AND DISTRIBUTION OF WATER IN ROME AND FIUMICINO (2018) (INDEX 0-100)
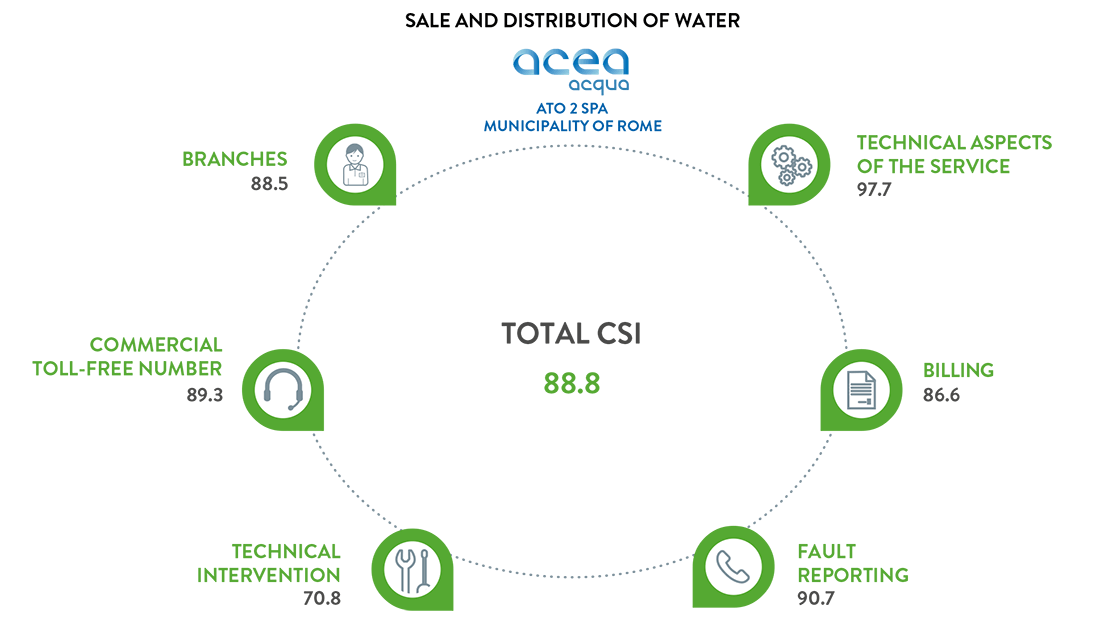
NB The Customer Satisfaction Indexes – overall and on the individual aspects of the service – shown in the chart are the average of the two semi-annual surveys.
SURVEYS ON CUSTOMER SATISFACTION WITH WATER SERVICE DELIVERED IN OTHER ATO 2 MUNICIPALITIES - CENTRAL LAZIO
Customer satisfaction surveys were also conducted in some other municipalities in the province of Rome. The two half-yearly surveys in 2018, conducted in April/May and in October, involved a sample of 2,000 residents, representative of all of the direct or condominium utilities present in the four “sentinel” municipalities: Frascati, Guidonia, Monterotondo and Tivoli – within the framework of Optimal Area of Operation 2 – Central Lazio. The overall rating recorded was 7.5 out of 10, in line with the previous year (7.4 out of 10).
The overall service satisfaction index, as an average of the two surveys, is 84.7 out of 100 (it was 83.7 out of 100 in 2017). With regard to the individual aspects subject to assessment, all satisfaction indexes relating to commercial aspects and contact channels have improved: branch service 74.6 out of 100 (was 69.8 out of 100), fault reports 77.8 out of 100 (was 71.6 out of 100), toll-free number 79.9 out of 100 (was 77 out of 100) and billing 92.2 out of 100 (88.8 out of 100 the previous year). Although it remained positive, the satisfaction index on technical service fell to 79.6 out of 100 (was 92.1 out of 100), while the evaluation of technical aspects (continuity of service and water pressure) remained very high and in line with the previous survey cycle at 91.7 out of 100 (91.8 out of 100 in 2017).
In the Frosinone area, the surveys on the perceived quality of the water service were conducted in April/May and October/ December 2018. The telephone interviews involved an overall sample of 4,000 residents in the municipalities of Optimal Area of Operation 5 - Frosinone, consisting in direct users, domestic and non-domestic.
The overall assessment of the water service, as an average of the two surveys, is 5.7 out of 10 (5.3 out of 10 in 2017), not yet in an area of full satisfaction but slightly higher.
Looking at the indices, however, there was a higher level of satisfaction.
The overall service satisfaction index rose to 77.5 out of 100 as an average of the two semi-annual surveys (in 2017 it was 70.8 out of 100). Satisfaction indices on almost all aspects of the service assessed also improve, in particular the technical or continuity aspects (from 58.8 out of 100 in 2017 to 69.3 out of 100), billing (69.6 out of 100, was 64.9 in 2017), the commercial toll-free number (90.7 out of 100, from 84.1 in the last survey cycle) and branch services (which rose to 94.7 out of 100 from 87.1). For the percentages of satisfaction with the individual quality elements see also Table no. 12.
CHART NO. 20 - OVERALL CSI AND ON ASPECTS OF THE WATER SERVICE - SALE AND DISTRIBUTION OF WATER IN FROSINONE AND VICINITY (2018) (INDEX 0-100)
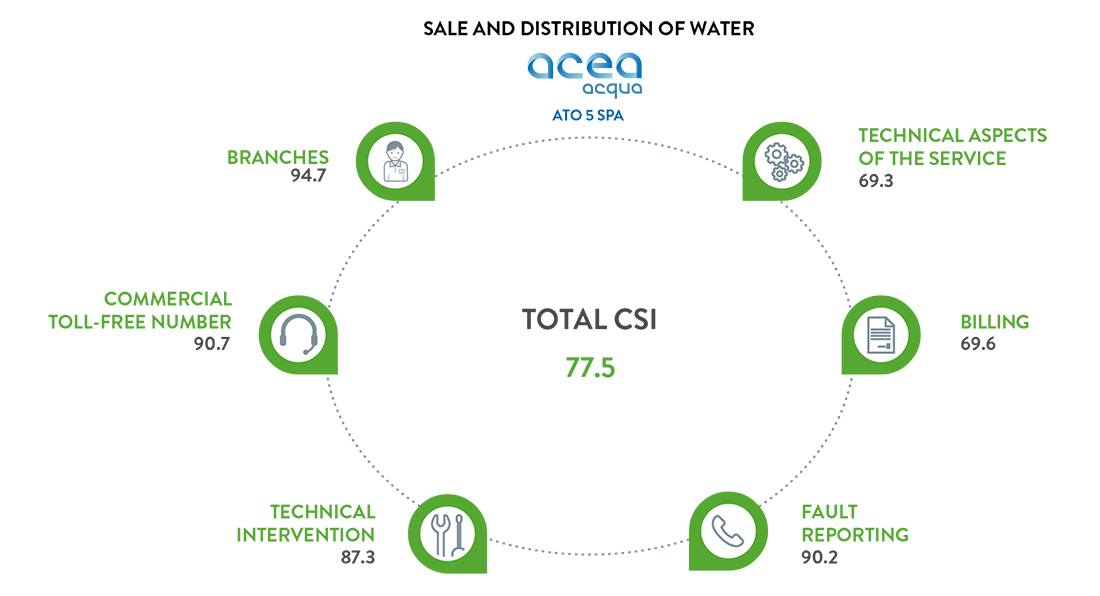
NB The Customer Satisfaction Indexes – overall and on the individual aspects of the service – shown in the chart are the average of the two semi-annual surveys.
As regards Gesesa, the operating company in Benevento and its province, a first customer satisfaction survey was carried out in the second half of 2018 34. To this end, in September/October 2018 telephone interviews were conducted with a sample of 500 people living in the municipalities of the managed Area, representing direct households or apartment complexes.
The overall assessment of the water service was rather good, at 7.3 out of 10. More specifically, satisfaction with both the technical aspects of the service and the billing aspects was noted. For the former, the “continuity of service” was assessed, considered the most important quality factor, for which 92% of customers said they were satisfied, and the “water pressure level” with 93.8% of satisfied customers. Among the quality elements of the billing, the items considered by customers as the most relevant were the “correctness of the amounts reported on the bill” and “the regular sending of invoices”. For both a high level of satisfaction was found, equal to 88.9% and 88.7% respectively.
34 - The results of the survey, which refer only to the second half of 2018, are illustrated only in the text and not also in graphic form and in the table since the data would not be comparable with the other surveys presented
TABLE NO. 12 - SOCIAL INDICATORS: CUSTOMER SATISFACTION (2017-2018)
| (average of the two interim reports) | ||||
| u. m. | 2017 | 2018 | ||
| ELECTRICAL SERVICE - SALE OF ENERGY (Rome and Formello) | ||||
| PROTECTED MARKET CUSTOMERS | ||||
| sales activity (CIS inclusive) | 0-100 | 88.9 | 92.2 | |
| ASPECTS OF THE SERVICE AND ELEMENTS OF QUALITY | ||||
| billing | 0-100 | 95.0 | 95.2 | |
| correctness of the amounts | % | 95.2 | 94.9 | |
| bill clear and easy to read | % | 96.2 | 95.3 | |
| internet website | 0-100 | 92.3 | 91.6 | |
| range of available operations | % | 91.7 | 93.0 | |
| ease of browsing the website | % | 92.7 | 93.6 | |
| commercial toll free number | 0-100 | 83.6 | 90.0 | |
| operator’s competence | % | 83.2 | 89.7 | |
| clarity of answers provided | % | 83.6 | 89.2 | |
| branch | 0-100 | 85.7 | 89.9 | |
| operator’s competence | % | 86.4 | 89.1 | |
| clarity of the information provided | % | 85.6 | 88.6 | |
| FREE MARKET CUSTOMERS | ||||
| sales activity (CIS inclusive) | 0-100 | 86.7 | 90.9 | |
| ASPECTS OF THE SERVICE AND ELEMENTS OF QUALITY | ||||
| billing | 0-100 | 88.5 | 92.4 | |
| correctness of the amounts | % | 87.6 | 91.3 | |
| bills sent regularly | % | 89.0 | 94.4 | |
| internet website | 0-100 | 87.3 | 86.6 | |
| range of available operations | % | 87.3 | 87.4 | |
| operation user friendliness | % | 88.6 | 83.3 | |
| commercial toll free number | 0-100 | 84.0 | 89.7 | |
| operator’s competence | % | 83.5 | 88.9 | |
| clarity of answers provided | % | 82.5 | 89.2 | |
| branch | 0-100 | 88.8 | 91.7 | |
| operator’s competence | % | 89.2 | 90.4 | |
| clarity of the information provided | % | 89.6 | 90.7 | |
| ELECTRICAL SERVICE - ENERGY DISTRIBUTION (Rome and Formello) | ||||
| distribution activity (CIS inclusive) | 0-100 | 93.2 | 95.5 | |
| ASPECTS OF THE SERVICE AND ELEMENTS OF QUALITY | ||||
| technical aspects of the service | 0-100 | 98.4 | 98.3 | |
| service continuity | % | 98.6 | 98.3 | |
| voltage constancy | % | 97.6 | 98.4 | |
| planned interruption | 0-100 | 90.5 | 95.0 | |
| correctness of information about recovery times | % | 91.2 | 95.4 | |
| prior notice of suspended supply | % | 90.0 | 95.2 | |
| fault reporting | 0-100 | 91.8 | 96.7 | |
| clarity of the information provided | % | 92.4 | 96.1 | |
| operator’s courtesy and availability | % | 95.3 | 97.7 | |
| technical intervention | 0-100 | 86.7 | 89.5 | |
| technicians’ competence | % | 90.8 | 92.7 | |
| intervention speed following the request | % | 80.8 | 85.2 | |
| PUBLIC LIGHTING SERVICE (Rome and Formello) | ||||
| lighting service (CIS inclusive) | 0-100 | 75.7 | 82.2 | |
| ASPECTS OF THE SERVICE AND ELEMENTS OF QUALITY | ||||
| technical aspects of the service (*) | 0-100 | 73.5 | 75.3 | |
| (directly depending on Acea) | ||||
| ASPECTS OF THE SERVICE AND ELEMENTS OF QUALITY | ||||
| service continuity | % | 71.6 | 72.7 | |
| light colouration | % | 77.5 | 83.4 | |
| (not directly depending on Acea) | ||||
| presence/network of the lighting service in the city | % | 74.2 | 73.9 | |
| degree/level of lighting (intensity) | % | 70.6 | 74.7 | |
| fault reporting | 0-100 | 78.6 | 92.1 | |
| operator’s courtesy and availability | % | 82.5 | 93.4 | |
| clarity of the information provided | % | 83.3 | 91.0 | |
| WATER SERVICE - SALE AND SUPPLY OF WATER - ACEA ATO 2 (Rome and Fiumicino) | ||||
| water service (CIS inclusive) | 0-100 | 84.7 | 88.8 | |
| ASPECTS OF THE SERVICE AND ELEMENTS OF QUALITY | ||||
| technical aspects of the service | 0-100 | 97.0 | 97.7 | |
| service continuity | % | 98.3 | 98.3 | |
| water pressure level | % | 92.3 | 95.5 | |
| billing | 0-100 | 80.9 | 86.6 | |
| correctness of the amounts | % | 84.9 | 88.7 | |
| bills sent regularly | % | 83.6 | 87.6 | |
| fault reporting | 0-100 | 87.2 | 90.7 | |
| clarity of the information provided | % | 84.0 | 89.5 | |
| operator’s courtesy and availability | % | 91.8 | 93.5 | |
| technical intervention | 0-100 | 64.6 | 70.8 | |
| intervention speed following the request | % | 53.3 | 57.7 | |
| understanding the problem and resolution skills | % | 73.0 | 81.2 | |
| commercial toll free number | 0-100 | 85.1 | 89.3 | |
| operator’s competence | % | 84.2 | 89.0 | |
| clarity of the information provided | % | 84.0 | 88.8 | |
| branch | 0-100 | 83.8 | 88.5 | |
| operator’s competence | % | 83.0 | 87.8 | |
| clarity of the information provided | % | 82.0 | 87.7 | |
| WATER SERVICE - SALE AND SUPPLY OF WATER - ACEA ATO 5 (municipalities covered by ATO 5 - Frosinone) | ||||
| water service (CIS inclusive) | 0-100 | 70.8 | 77.5 | |
| ASPECTS OF THE SERVICE AND ELEMENTS OF QUALITY | ||||
| technical aspects of the service | 0-100 | 58.8 | 69.3 | |
| service continuity | % | 57.3 | 68.6 | |
| water pressure level | % | 66.5 | 73.3 | |
| billing | 0-100 | 64.9 | 69.6 | |
| correctness of the amounts | % | 68.5 | 69.2 | |
| bill clear and easy to read | % | 63.6 | 68.6 | |
| fault reporting | 0-100 | 86.8 | 90.2 | |
| clarity of the information provided | % | 88.0 | 91.5 | |
| operator’s courtesy and availability | % | 92.8 | 94.0 | |
| technical intervention | 0-100 | 91.0 | 87.3 | |
| understanding the problem and resolution skills | % | 98.3 | 87.7 | |
| intervention speed following the request | % | 80.0 | 83.5 | |
| commercial toll free number | 0-100 | 84.1 | 90.7 | |
| operator’s competence | % | 83.0 | 88.7 | |
| clarity of the information provided | % | 84.8 | 92.0 | |
| branch | 0-100 | 87.1 | 94.7 | |
| operator’s competence | % | 90.3 | 95.7 | |
| clarity of the information provided | % | 87.5 | 94.7 |
(*) The average of the assessments of the technical aspects dependent on and not dependent on Acea is shown below.
NB The table only includes quality factors that the sample interviewed deems to be most important in 2018; this may give rise to consequent changes in column 2017. Furthermore, in the right hand column there are significant differences, equal to 5 points or more. In any case, it must be taken into consideration that the value indicating adequate customer satisfaction is equal or more than 75% (threshold value).