Procurement of goods, services and works
Reference boundary
The information given in the paragraph concerns all companies included in the scope – see Disclosing sustainability: Methodological note – with the exception of Gesesa. This guarantees full comparability with data from the previous year.
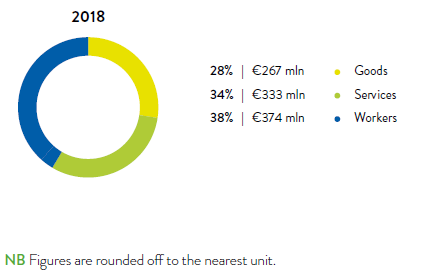
Tenders for the supply of goods, the performance of services and the completion of works were managed, at centralised level, for the companies included in the disclosure. Contracts awarded in the year had a comprehensive economic value of more than 974 million Euros 87, 64% more than the 594 million in the previous year. The increase in amounts, in absolute value, was mainly recorded for items works and goods (see Table no. 33 for data comparison).
[87] The amount refers to tenders awarded during the year, without any distinction between investments and operating cost, annual and multi-annual contracts. Purchases of commodities, regularisation orders and intercompany orders are excluded.
Chart no. 26 – value of procurement of goods, services and works and percentage on total (2018)
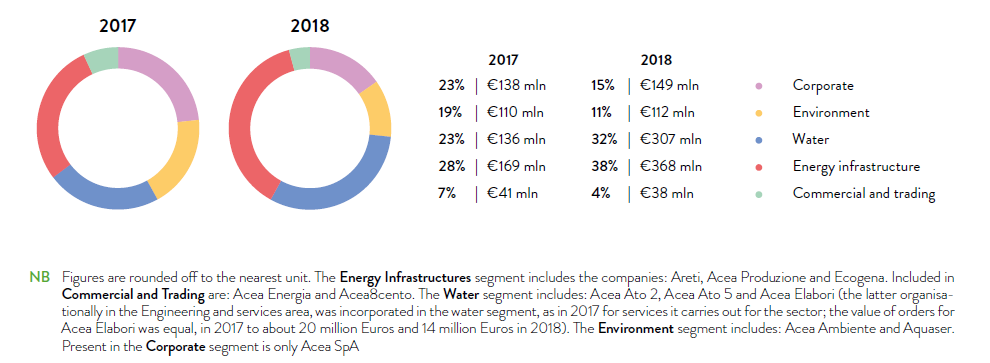
Looking at the purchasing values for the business macro areas – Energy infrastructure (generation and networks), Commercial and Trading (sales and call centres), Water (including Acea Elabori, for services provided to the sector), nvironment (waste-to-energy and environmental services) and Corporate (Acea SpA) – during the year, the Energy Infrastructure segment accounted for the largest share of the total (38%), followed by the Water segment (31.5%), and, with respect to the 2017 figures, the same two areas showed an increase in the amounts of all orders: works, in particular, but also goods and services (see Chart no. 27 and Table no. 33).
Chart no. 27 – orders (goods, services, works) by business area (2017-2018)
The Group companies included in the scope of consolidation made a total of 2,195 Purchase Orders, slightly higher than last year (2,073 Orders), involving 1,151 suppliers (1,069 in 2017).
Approximately 86% of Purchase Orders for goods and services were valued below the EU threshold. The top ten works suppliers accounted for around 66% of the total value of the contracted works, while the top ten suppliers of goods and services respectively accounted for around 36% and 32% of the total value of goods and services procured (see Table 34).
The slight increase in the total number of suppliers in 2018 (approx. 80 more than 2017) took place in a proportionate manner in terms of geographic components (both expressed in macro regions and focussing on Lazio). Geographical distribution of the suppliers was in line with previous years, with about 90% being concentrated in the central-northern area of Italy, and the number of suppliers in Lazio retains a consistent percentage equal to 45% of the total (46% in 2017, see Table no. 34).
The geographical distribution of the amounts among the macro-regions, in terms of percentage weight of the total amounts, remained fairly constant for goods and services. On the other hand, the value of works carried out by companies in central Italy increased more significantly (from 65% in 2017 to 75% in 2018).
Chart no. 28 – geographical distribution of the amounts used for the purchase of goods and services in Italy and abroad (2018)
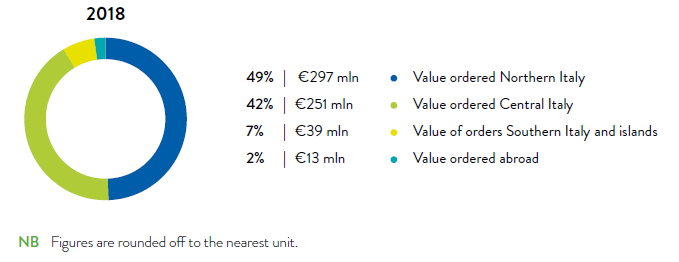
Chart no. 29 – geographical distribution of the amounts of works awarded in italy and abroad
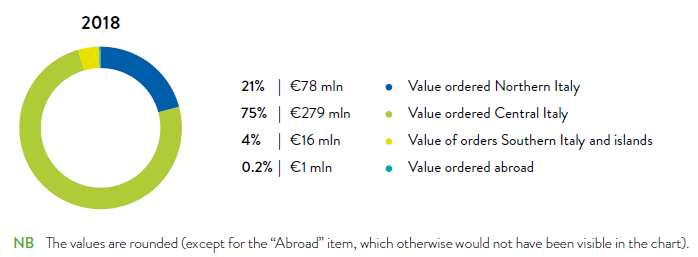
Table no. 33 - SOCIAL INDICATORS: PROCUREMENT DATA (2016-2018)
| u. m. | 2016 (*) | 2017 | 2018 | % 2018/2017 | |
| VALUE OF CONTRACTS | |||||
| goods | mln. € | 132 | 137 | 267 | 95% |
| services | mln. € | 245 | 304 | 333 | 9% |
| works | mln. € | 133 | 153 | 374 | 144% |
| total | mln. € | 510 | 594 | 974 | 64% |
| GOODS, SERVICES AND WORKS AS A PERCENTAGE | |||||
| goods | % | 26 | 23 | 28 | 22% |
| services | % | 48 | 51 | 34 | -33% |
| works | % | 26 | 26 | 38 | 46% |
| VALUE OF ORDERS BY BUSINESS AREA (**) | |||||
| Energy infrastructure | mln. € | 128 | 169 | 368 | 118% |
| Commercial and trading | mln. € | 34 | 41 | 38 | -7% |
| Water | mln. € | 151 | 136 | 307 | 126% |
| Enviroment | mln. € | 56 | 110 | 112 | 2% |
| Corporate | mln. € | 141 | 138 | 149 | 8% |
| NUMBER OF PURCHASE ORDERS MANAGED | |||||
| POs for goods, services and works | n. | 1,981 | 2,073 | 2,195 | 6% |
(*) The 2018 and 2017 perimeters are equivalent, while 2016, compared to corporate scope for 2017, included data related to Acea Illuminazione Pubblica (which were transferred to Areti in 2017), Acea Gori Servizi (in 2017 no longer consolidated using the step by step method), Crea Gestioni, Elgasud (later renamed Acea Liquidation and Litigation) and Acea Energy Management (the total amount ordered by the latter 4 companies in 2016 was € 1.3 million).
(**) The 2018 and 2017 perimeters are equivalent, and to ensure comparability over the three-year period the 2016 figures had already been reclassified in line with the 2017 reorganisation of the business areas.
NB: All the figures in the table are rounded off to the nearest unit. Acea Elabori, organisationally part of the Engineering and services area, was incorporated in the Water area in the table, for the services it carries out for the sector.
Table n. 34 - SOCIAL INDICATORS: PROCUREMENT NATIONWIDE (2016-2018)
| u.m. | 2016* | as % of total/year | 2017 | as % of total/year | 2018 | as % of total/year | |
| NUMBER OF SUPPLIERS OF GOODS, SERVICES AND WORKS NATIONWIDE | |||||||
| suppliers Northern Italy | n. | 340 | 34% | 356 | 33% | 385 | 34% |
| suppliers Central Italy | n. | 579 | 57% | 620 | 58% | 657 | 57% |
| suppliers Lazio | n. | 445 | 44% | 489 | 46% | 518 | 45% |
| suppliers Southern Italy and islands | n. | 70 | 7% | 74 | 7% | 84 | 7% |
| foreign suppliers | n. | 16 | 2% | 19 | 2% | 25 | 2% |
| total suppliers | n. | 1,005 | 100% | 1,069 | 100% | 1,151 | 100% |
| TOP 10 SUPPLIERS OF GOODS, SERVICES AND WORKS (amounts awarded) | |||||||
| TOP 10 suppliers of goods | mln. € | 74 | 56% (on total amount of goods 2016) | 52 | 38% (on total amount of goods 2017) | 97 | 36% (on total amount of goods 2018) |
| TOP 10 suppliers of goods | mln. € | 127 | 52% (on total amount of goods 2016) | 129 | 42% (on total amount of goods 2017) | 105 | 32% (on total amount of goods 2018) |
| TOP 10 suppliers of works | mln. € | 75 | 56% (on total amount of goods 2016) | 65 | 42% (on total amount of goods 2017) | 248 | 66% (on total amount of goods 2018) |
| GEOGRAPHICAL BREAKDOWN OF AMOUNTS FOR GOODS AND SERVICES | |||||||
| Value ordered Northern Italy | mln. € | 210 | 56% | 213 | 48% | 297 | 49% |
| Value ordered Central Italy | mln. € | 152 | 40% | 198 | 45% | 251 | 42% |
| Value ordered Lazio | mln. € | 125 | 33% | 160 | 36% | 191 | 32% |
| Value of orders Southern Italy and islands | mln. € | 10 | 3% | 22 | 5% | 39 | 7% |
| Value ordered abroad | mln. € | 4 | 1% | 8 | 2% | 13 | 2% |
| tTotal value of orders for goods and services | mln. € | 376 | 100% | 441 | 100% | 600 | 100% |
| GEOGRAPHICAL BREAKDOWN OF AMOUNTS FOR WORKS | |||||||
| Value ordered Northern Italy | mln. € | 9 | 7% | 37 | 24% | 78 | 21% |
| Value ordered Central Italy | mln. € | 110 | 82% | 99 | 65% | 279 | 75% |
| Value ordered Lazio | mln. € | 107 | 80% | 90 | 59% | 120 | 32% |
| Value of orders Southern Italy and islands | mln. € | 14 | 11% | 12 | 8% | 16 | 4% |
| Value ordered abroad | mln. € | 0 | 0% | 5 | 3% | 1 | 0% |
| Total ordered for works | mln. € | 133 | 100% | 153 | 100% | 374 | 100% |
(*) The 2018 and 2017 perimeters are equivalent, while 2016, compared to corporate perimeter for 2017, included data related to Acea Illuminazione Pubblica (which were transferred to Areti in 2017), Acea Gori Servizi (in 2017 no longer consolidated using the step by step method), Crea Gestioni, Elgasud (later renamed Acea Liquidation and Litigation) and Acea Energy Management (the total amount ordered by the latter 4 companies in 2016 was € 1.3 million).
NB All the figures in the table are rounded off to the nearest unit. The “northern Italy” geographical area includes Valle d’Aosta, Piedmont, Lombardy, Veneto, Trentino-Alto Adige, Friuli Venezia Giulia, Emilia-Romagna and Liguria; “central Italy” includes Tuscany, Umbria, Marche, Lazio, Abruzzo and Molise; “southern Italy and islands” includes Campania, Basilicata, Apulia, Calabria, Sicily and Sardinia.