Acea's employees
The workforce included in the report 94, which includes the companies consolidated according to the net assets method suitable for representing the operations of the Group, totals 4,742 persons.
A breakdown by business segment shows an increase of 10.5% in the number of employees in the Corporate segment and a slight increase in the number of employees in the Sales and Trading segment (+1.4%) and in the Energy nfrastructure segment (+1.2%). There were only small decreases in the Water segment (-1.6%) and the Environment segment (-0.7%). Relative to the geographic location of the employees, considering both the registered office of the companies and the operating locations, almost all of them are concentrated in Lazio, with a residual number in Campania, Umbria and Tuscany.
TABLE NO. 35 - CHANGES IN EMPLOYEES BY MACRO SEGMENT (2016-2018)
| BUSINESS AEREA | 2016 (*) (no. of employees) | 2017 (no. of employees) | 2018 (no. of employees) |
| water | 2,029 | 2,011 | 1,978 |
| energy infrastructures | 1,370 | 1,362 | 1,379 |
| commercial and trading | 449 | 437 | 443 |
| enviroment | 247 | 288 | 286 |
| corporate (Acea SpA) | 573 | 594 | 656 |
| total | 4,668 | 4,692 | 4,742 |
(*) Remember that the 2016 data included, in the Water Area, also 88 employees of Acea Gori Servizi and Crea Gestioni no longer included in the 2017 and 2018 scopes. Acea Elabori, organisationally included in the Engineering and Services Area, is also included in the Water Area, for the services provided to the sector, with a total of 233 employees in 2016, 270 in 2017 and 237 in 2018.
[94] See also Methodological Note. The total workforce, for all the companies within the consolidation, was 6,534 during the year (5,625 in 2017). The perimeter ensures the comparison of the data with the preceding year.
Composition and turnover
The Human Resources Management Department of Acea SpA handles the administrative management of employed personnel for and on behalf of the subsidiaries; therefore, the information and data reported below cover the entire scope of the consolidated non-financial declaration (see Disclosing sustainability: methodological note) and ensure adequate comparability with the previous year 95.
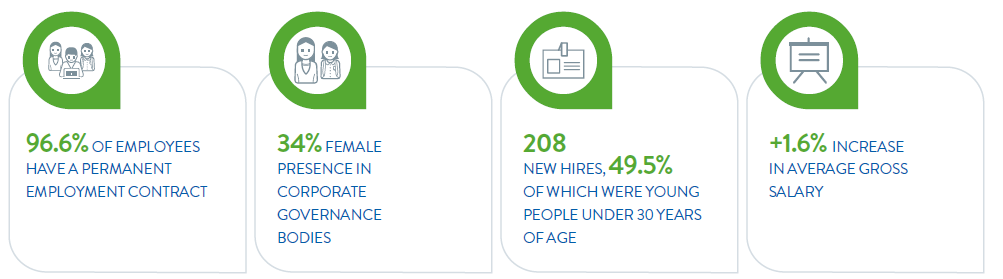
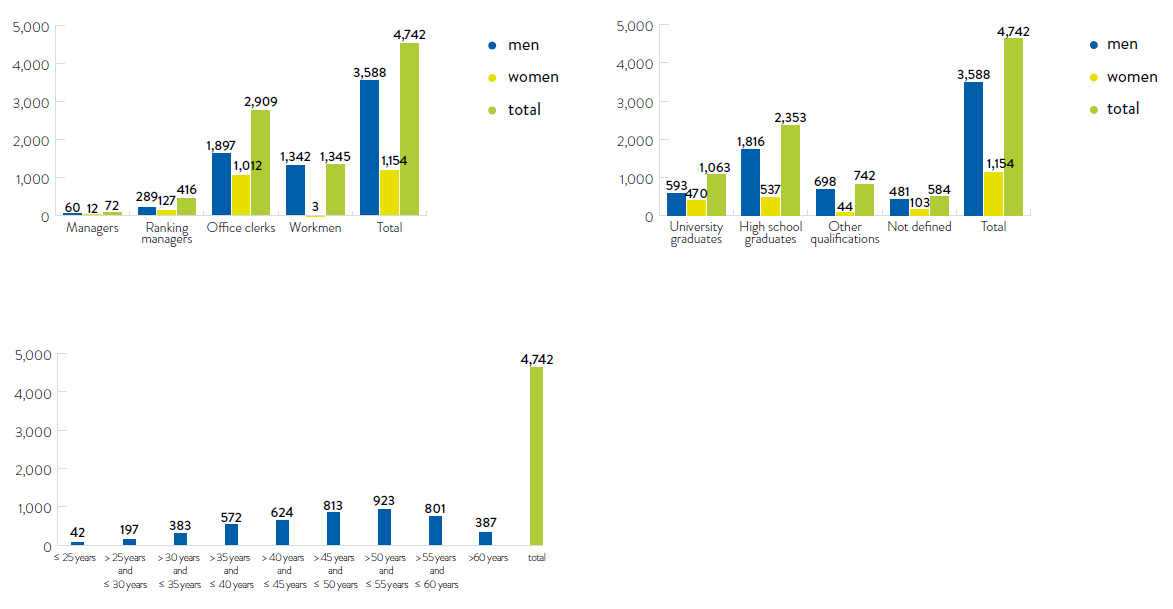
Of the 4,742 people who work in the Group (there were 4,692 in 2017), 61.3% were classified as clerical workers, 28.4% as workmen, 8.8% as managers while executives represent 1.5%.
The level of schooling confirms the steady increase of university graduates, who rise to 22.4% (21.2% in 2017) and the stability of high school graduates, whose percentage weight remains unchanged at 49.6%, and employees with other qualifications equal to 15.6% (15.3% in 2017).
The age of the employees is consistent with the preceding year: approx. 62% of the staff are over 45 years of age, 33% are between 30 and 45 years and 5% are under 30. Even the average age remains stable at 47.8 years (for all the aforementioned data please see Chart no. 30 and Table no. 36).
[95] The 2018 scope of the Financial Statements/DNF, which coincides with that of 2017, includes the following companies: Acea SpA, Acea Ambiente, Aquaser, Acea Energia, Acea8cento, Areti, Acea Produzione, Ecogena, Acea Ato 2, Acea Ato 5, Gesesa, Acea Elabori. See Disclosing Sustainability: methodological note. In 2016,Acea Gori Servizi (62 employees) were also included, which in 2017 was no longer consolidated using the full consolidation method, and Crea Gestioni (26 employees).
The difference in the scope therefore, involves the data relative to 88 people.
Chart no. 30 – staff composition: category, gender, level of education and age (2018)
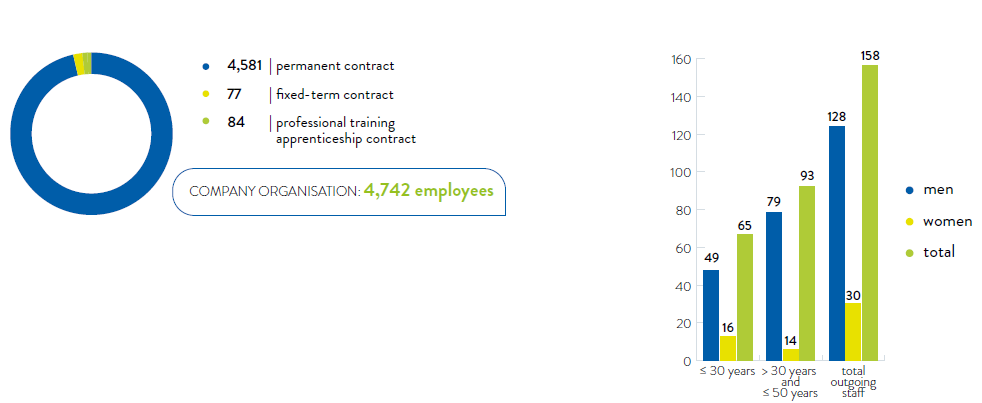
The percentage of personnel employed in the Group with a permanent contract remains very high: 96.6%, or 4,581 employees.
The length of the employment relationship, relative to the employees who every year leave the company, still indicates the stability of employment: 41% of the employees leaving worked for the Group up to 30 years and 58.9% for a period of between more than 30 and 50 years (see Chart no. 31 and Tables no. 36 and 38).
Chart no. 31 – Contract types and the lenght of the employment relationship (2018)
In 2018, the rate of turnover was 7.7% (8% for men and 6.9% for women), the incoming rate stable at 4.4% (4.4% for men and 4.3% for women) and the outgoing rose to 3.3% (3.6% for men and 2.6% for women) (see Table no. 37).
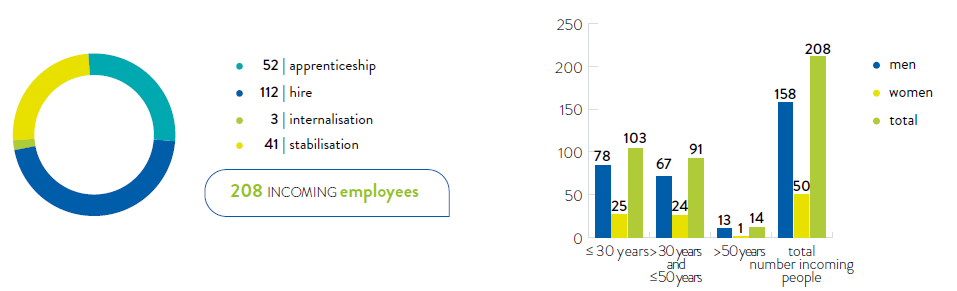
The number of people hired remained stable compared to 2017, at 208 (158 men and 50 women). The entries are mainly the result of 112 hires from the external labour market, 52 apprentices and 41 stabilisations (see Chart no. 32 and Table no. 37). The companies most affected by the inflows of personnel were Acea Ato 2 with 60 hires, Areti with 42 hires, Acea Elabori with 31 hires and Acea SpA with 24 hires (including hires, transformation to permanent status and apprenticeships).
Overall, in 2018 60.6% of the hires had permanent contracts (a net increase compared to 41% in 2017) and 25% with professional apprenticeship contracts.
49.5% of the incoming staff are 30 years old or younger.
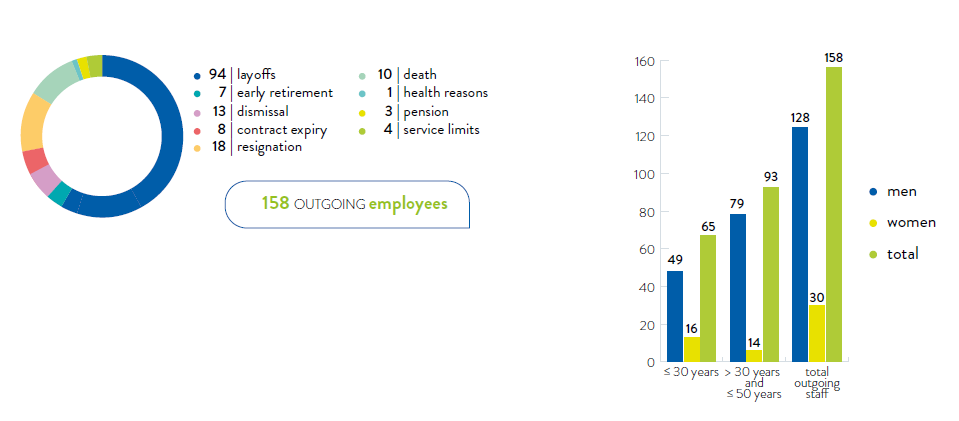
Chart no. 32 – The reasons for the entries and age of the staff (2018)
There were 158 people who left the company during the year, of which 128 men and 30 women, an increase of 63% compared to the 97 employees who left in 2017. In particular, 94 employees were laid off, a form of subsidised voluntary early retirement and 18 people resigned, 13 were dismissed and 7 employees were involved in the facilitated voluntary retirement plans, with the agreed and subsidised early termination of the employment agreement with the company (Chart no. 33 and Tables no. 37 and 38). 80% of the outgoing staff was over 50 years of age.
Women in Acea
There were 1,154 female workers in Acea in 2018: 24.3% of the workforce. The figure is similar to the preceding year (24.2% in 2017). The smaller presence of female workers in the Group compared to the male workers can be related to the operational nature of the processes managed: to date, in fact, in Italy, professional positions of a technical-specialised nature are still predominantly held by men (Chart no. 34).
Chart no. 34 – the distribution of the staff from a perspective of gender (2018)
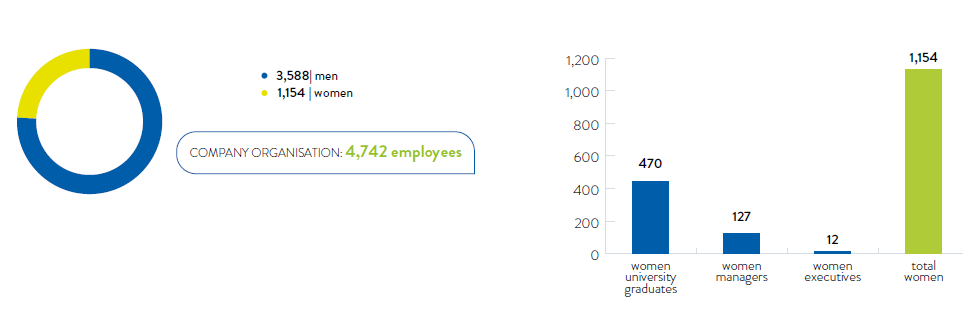
During the year, the presence of women among executives fell by about one percentage point (12 out of 72, equal to 16.7%) and the presence of women among managers remained substantially stable (127 out of 416, equal to 30.5%); the percentage of women graduates of the total number of university graduates in the workforce also remained stable (470 out of 1,063, equal to 44.2%). 48 women were in the corporate governance of the companies included in the reporting scope (Boards of Directors, Boards of Statutory Auditors and Supervisory Bodies), equal to 34% of the total number of members (in 2017 in comparison, women in the governance bodies totalled 49, equal to 33%). The percentage of women on the Board of Directors of the Parent Company is 33.3% (3 women out of 9 members), in full compliance with Law no. 120/2011.
In particular, we report that every one of the internal board committees includes one or more women and the Chair of the Control and Risks, Appointments and Remuneration, Ethics and Sustainability Committees is assigned to a female Director (see also Corporate Identity, section Corporate governance in Acea).
Chart n. 35 – presence of women in the corporate governance bodies (2016-2018)
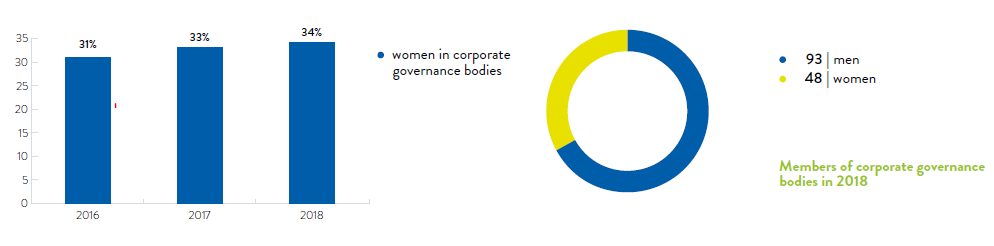
TABLE NO. 36 - SOCIAL INDICATORS: GENERAL DATA ON THE STAFF (2016-2018)
| 2016 (*) | 2017 | 2018 | |||||||||||||||||
| men | women | total | men | women | total | men | women | total | |||||||||||
| composition of the staff | |||||||||||||||||||
| number | |||||||||||||||||||
| executives | 67 | 14 | 81 | 66 | 14 | 80 | 60 | 12 | 72 | ||||||||||
| managers | 271 | 117 | 388 | 278 | 123 | 401 | 289 | 127 | 416 | ||||||||||
| clerical workers | 1,892 | 953 | 2,845 | 1,891 | 993 | 2,884 | 1,897 | 1,012 | 2,909 | ||||||||||
| workmen | 1,351 | 3 | 1,354 | 1,324 | 3 | 1,327 | 1,342 | 3 | 1,345 | ||||||||||
| total | 3,581 | 1,087 | 4,668 | 3,559 | 1,133 | 4,692 | 3,588 | 1,154 | 4,742 | ||||||||||
| WOMEN IN ACEA | |||||||||||||||||||
| % | |||||||||||||||||||
| deomen out of the total workforce | 23.3 | 24.2 | 24.3 | ||||||||||||||||
| female executives out of total executives | 17.3 | 17.5 | 16.7 | ||||||||||||||||
| female managers out of total managers | 30.2 | 30.7 | 30.5 | ||||||||||||||||
| female graduates out of total graduates | 43.4 | 44.6 | 44.2 | ||||||||||||||||
| LEVEL OF EDUCATION OF THE STAFF | |||||||||||||||||||
| number | |||||||||||||||||||
| university graduates | 511 | 392 | 903 | 551 | 444 | 995 | 593 | 470 | 1,063 | ||||||||||
| high school graduates | 1,768 | 522 | 2,290 | 1,790 | 536 | 2,326 | 1,816 | 537 | 2,353 | ||||||||||
| other securities | 723 | 47 | 770 | 713 | 46 | 759 | 698 | 44 | 742 | ||||||||||
| not defined | 579 | 126 | 705 | 505 | 107 | 612 | 481 | 103 | 584 | ||||||||||
| total | 3,581 | 1,087 | 4,668 | 3,559 | 1,133 | 4,692 | 3,588 | 1,154 | 4,742 | ||||||||||
| AVERAGE STAFF AGE | |||||||||||||||||||
| years | |||||||||||||||||||
| average company age | 48.2 | 44.7 | 47.4 | 48.6 | 44.9 | 47.7 | 48.6 | 45.2 | 47.8 | ||||||||||
| average age of executives | 53.5 | 49.8 | 52.9 | 54.1 | 50.8 | 53.6 | 53.9 | 52.1 | 53.6 | ||||||||||
| average age of managers | 50.4 | 47.8 | 49.6 | 51.0 | 48.6 | 50.3 | 50.9 | 49.1 | 50.4 | ||||||||||
| average age of clerical workers | 48.1 | 44.2 | 46.8 | 48.4 | 44.3 | 47.0 | 48.5 | 44.6 | 47.1 | ||||||||||
| average age of workmen | 47.5 | 48.7 | 47.5 | 48.0 | 49.7 | 48.0 | 48.0 | 50.7 | 48.0 | ||||||||||
| AVERAGE SENIORITY OF THE STAFF | |||||||||||||||||||
| years | |||||||||||||||||||
| average corporate seniority | 18.9 | 15.5 | 18.1 | 19.3 | 15.4 | 18.3 | 19.1 | 15.5 | 18.2 | ||||||||||
| average seniority of executives | 19.5 | 17.7 | 19.2 | 19.0 | 18.7 | 19.0 | 17.5 | 18.6 | 17.7 | ||||||||||
| average seniority of managers | 20.8 | 18.0 | 19.9 | 21.4 | 18.3 | 20.5 | 20.6 | 18.8 | 20.0 | ||||||||||
| average seniority of clerical workers | 20.0 | 15.1 | 18.4 | 20.4 | 14.9 | 18.5 | 20.3 | 15.0 | 18.4 | ||||||||||
| average seniority of workmen | 16.8 | 27.0 | 16.8 | 17.3 | 28.0 | 17.3 | 17.1 | 29.0 | 17.1 | ||||||||||
| TYPE OF EMPLOYMENT CONTRACT | |||||||||||||||||||
| number | |||||||||||||||||||
| staff with permanent contract | 3,531 | 1,068 | 4,599 | 3,456 | 1,071 | 4,527 | 3,476 | 1,105 | 4,581 | ||||||||||
| (of which) part-time staff | 25 | 83 | 108 | 27 | 99 | 126 | 25 | 95 | 120 | ||||||||||
| permanent staff | 23 | 14 | 37 | 69 | 58 | 127 | 44 | 33 | 77 | ||||||||||
| staff under apprenticeship contracts | 27 | 5 | 32 | 34 | 4 | 38 | 68 | 16 | 84 | ||||||||||
| totale | 3,581 | 1,087 | 4,668 | 3,559 | 1,133 | 4,692 | 3,588 | 1,154 | 4,742 | ||||||||||
(*) The 2016 figure included 88 employees of two companies (Acea Gori Servizi and Crea Gestioni) no longer included in the scope of the two-year period.
TABLE NO. 37 - SOCIAL INDICATORS: CHANGES IN STAFF (2016-2018)
| number | 2016 | 2017 | 2018 | |||||||||||||
| men | women | total | men | women | total | men | women | total | ||||||||
| INCOMING STAFF: CONTRACT TYPE | ||||||||||||||||
| permanent | 60 | 20 | 80 | 59 | 26 | 85 | 97 | 29 | 126 | |||||||
| fixed-term | 26 | 15 | 41 | 58 | 52 | 110 | 20 | 10 | 30 | |||||||
| professional apprenticeship contracts | 24 | 5 | 29 | 11 | 1 | 12 | 41 | 11 | 52 | |||||||
| business branch acquisition | 4 | 1 | 5 | 0 | 0 | 0 | 0 | 0 | 0 | |||||||
| total | 114 | 41 | 155 | 128 | 79 | 207 | 158 | 50 | 208 | |||||||
| OUTGOING STAFF: GROUNDS | ||||||||||||||||
| layoffs | 81 | 16 | 97 | 39 | 2 | 41 | 80 | 14 | 94 | |||||||
| early retirement | 8 | 2 | 10 | 10 | 2 | 12 | 7 | 0 | 7 | |||||||
| retirement | 4 | 0 | 4 | 2 | 0 | 2 | 2 | 1 | 3 | |||||||
| terminations | 18 | 6 | 24 | 9 | 0 | 9 | 11 | 2 | 13 | |||||||
| other reasons (*) | 24 | 4 | 28 | 24 | 9 | 33 | 28 | 13 | 41 | |||||||
| total | 135 | 28 | 163 | 84 | 13 | 97 | 128 | 30 | 158 | |||||||
| TURNOVER RATES, ENTRY AND EXIT RATES BY AGE GROUP (**) | ||||||||||||||||
| % | ||||||||||||||||
| turnover rate | 6.9 | 6.3 | 6.8 | 5.9 | 8.1 | 6.5 | 8.0 | 6.9 | 7.7 | |||||||
| incoming rate | 3.2 | 3.8 | 3.3 | 3.6 | 6.9 | 4.4 | 4.4 | 4.3 | 4.4 | |||||||
| ≤ 30 years | - | - | 1.5 | - | - | 1.5 | - | - | 2.2 | |||||||
| > 30 years and ≤ 50 years | - | - | 1.5 | - | - | 2.6 | - | - | 1.9 | |||||||
| >50 years | - | - | 0.3 | - | - | 0.3 | - | - | 0.3 | |||||||
| outgoing rate | 3.8 | 2.6 | 3.5 | 2.4 | 1.1 | 2.1 | 3.6 | 2.6 | 3.3 | |||||||
| ≤ 30 years | - | - | 0.1 | - | - | 0.1 | - | - | 0.3 | |||||||
| > 30 years and ≤ 50 years | - | - | 0.6 | - | - | 0.5 | - | - | 0.4 | |||||||
| >50 years | - | - | 2.8 | - | - | 1.5 | - | - | 2.6 | |||||||
(*) In 2018 the item includes: 10 deaths, 18 resignations, 1 disability, 8 contract expiry and 4 service limits.
(**) The turnover rate is provided by the sum of hires and terminations of the year relative to the workforce at year end. The companies to which the data refers are predominantly located in Lazio.
TABLE NO. 38 - SOCIAL INDICATORS: AGE GROUPS, EMPLOYMENT CONTRACT LENGTH (2016-2018)
| 2016 | 2017 | 2018 | |||||||
| STAFF AGE GROUPS | |||||||||
| number | men | women | total | men | women | total | men | women | total |
| ≤ 25 years | 33 | 2 | 35 | 31 | 2 | 33 | 40 | 2 | 42 |
| > 25 years and ≤ 30 years | 87 | 61 | 148 | 98 | 63 | 161 | 129 | 68 | 197 |
| > 30 years and ≤ 35 years | 266 | 136 | 402 | 257 | 144 | 401 | 248 | 135 | 383 |
| > 35 years and ≤ 40 years | 374 | 187 | 561 | 361 | 195 | 556 | 363 | 209 | 572 |
| > 40 years and ≤ 45 years | 506 | 173 | 679 | 461 | 169 | 630 | 459 | 165 | 624 |
| > 45 years and ≤ 50 years | 715 | 218 | 933 | 665 | 216 | 881 | 618 | 195 | 813 |
| > 50 years and ≤ 55 years | 716 | 161 | 877 | 726 | 165 | 891 | 739 | 184 | 923 |
| > 55 years and ≤ 60 years | 683 | 120 | 803 | 644 | 143 | 787 | 648 | 153 | 801 |
| > 61 years | 201 | 29 | 230 | 316 | 36 | 352 | 344 | 43 | 387 |
| total | 3,581 | 1,087 | 4,668 | 3,559 | 1,133 | 4,692 | 3,588 | 1,154 | 4,742 |
| INCOMING STAFF: AGE GROUPS | |||||||||
| ≤ 30 years | 50 | 22 | 72 | 43 | 26 | 69 | 78 | 25 | 103 |
| > 30 years and ≤ 50 years | 49 | 19 | 68 | 74 | 51 | 125 | 67 | 24 | 91 |
| > 50 years | 15 | 0 | 15 | 11 | 2 | 13 | 13 | 1 | 14 |
| total | 114 | 41 | 155 | 128 | 79 | 207 | 158 | 50 | 208 |
| OUTGOING STAFF: AGE GROUPS | |||||||||
| ≤ 30 years | 4 | 0 | 4 | 5 | 2 | 7 | 7 | 6 | 13 |
| > 30 years and . 50 years | 24 | 5 | 29 | 18 | 4 | 22 | 14 | 5 | 19 |
| > 50 years | 107 | 23 | 130 | 61 | 7 | 68 | 107 | 19 | 126 |
| total | 135 | 28 | 163 | 84 | 13 | 97 | 128 | 30 | 158 |
| DURATION OF THE EMPLOYMENT CONTRACT OF THE OUTGOING STAFF | |||||||||
| ≤ 20 years | 44 | 6 | 50 | 38 | 7 | 45 | 31 | 11 | 42 |
| > 20 years and ≤ 30 years | 23 | 4 | 27 | 19 | 0 | 19 | 18 | 5 | 23 |
| > 30 years and ≤ 40 years | 66 | 17 | 83 | 26 | 5 | 31 | 75 | 14 | 89 |
| > 40 years and ≤ 50 years | 2 | 1 | 3 | 1 | 2 | 4 | 0 | 4 | |
| total | 135 | 28 | 163 | 84 | 13 | 97 | 128 | 30 | 158 |